This page presents the MTS Design example for ZCU1275/ZCU1285 device.
Table of Contents
| Table of Contents | ||
|---|---|---|
|
ZCU1275/ZCU1285 Build and Run Flow Tutorial
The below sections describe the build and run flow tutorial.
The design package for ZCU1275/ZCU1285 16X16 can be found at the following links:
Vivado Build Flow
Refer to the Vivado Design Suite User Guide: Using the Vivado IDE, UG893, for setting up Vivado environment.
To build the hardware design, execute the following steps
On Windows
- Open a Vivado Tool.
- Navigate to the package folder path and change the directory to ../pl/MTS-IQ folder for MTS IQ design.
- On the Tcl Console of the tool, type
source ./scripts/create_project.tcl
On Linux
Set $DCET_HOME environment variable as given below for linux environment.
| Code Block |
|---|
% export DCET_HOME=</path/to/download/zipfile>/rdf0xxx-zc1275-RFdc-16x16-mts-design-2018-3 |
- Open a Linux terminal.
- Change directory to $DCET_HOME/pl/MTS-IQ folder for MTS IQ design.
- To create the Vivado IPI project and invoke the UI, run the following command.
| Code Block |
|---|
% vivado -source scripts/create_project.tcl |
After executing the script on windows/linux systems, the vivado IPI block design comes up as shown in the following figure.
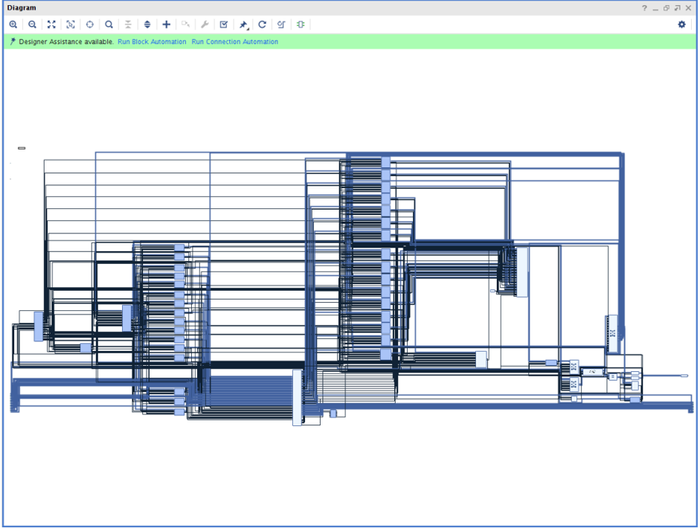
4. Click the "Generate Bitstream" on left hand side of Vivado Project Panel.
| Note |
|---|
If the user gets any pop-up with "No implementation Results available". Click "Yes". Then, if any pop-up comes up with "Launch runs", Click "OK". |
The design is implemented, and a pop-up window comes up saying "Open Implemented Design". Click "OK".

Below figure depicts the view of opened implemented design.
| Note |
|---|
The actual results might graphically look different than the image shown. |

5. Go to File > Export > Export Hardware
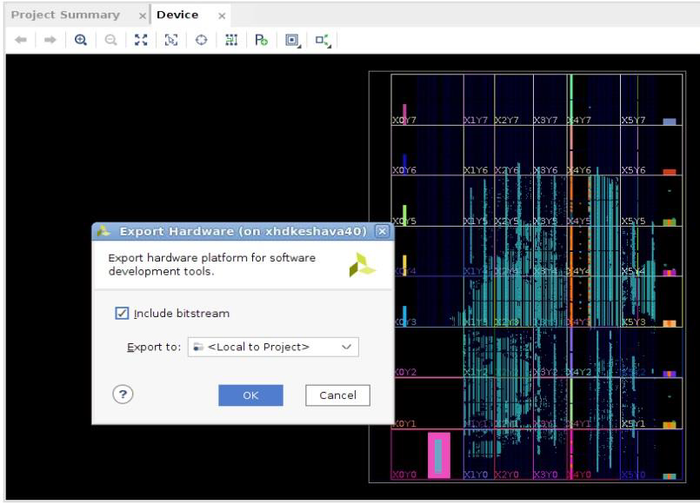
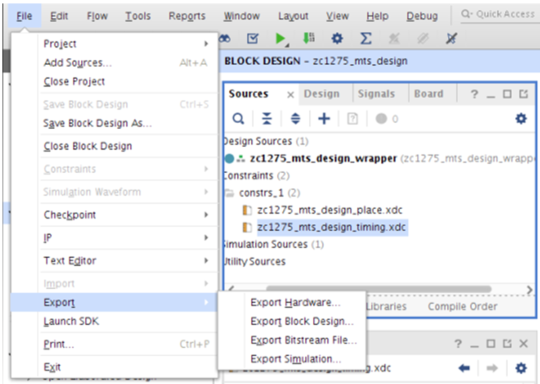 6. In the Export Hardware Platform for SDK window select "Include bitstream" and click "OK".
The HDF is created at $DCET_HOME/pl/MTS-IQ/project/zc1275_mts_design.sdk/zc1275_mts_design_wrapper.hdf for MTS IQ Design.
...
After exiting the application ADC_DATA.csv file is copied in the SD card.
Remove the SDcard and plot the ADC content in Excel sheet.
Find below reference plot for IQ data capture. As can be seen in the plot all the signal sent through DACs and received through ADCs are aligned.
| Note |
|---|
Excel can not plot waveforms for larger sample sizes. The examples given below are for 1K sample. Based on number of samples that can be plotted please select appropriate number of sample sizes (Excel rows) from .CSV file. For observing larger sample sizes please use .CSV compliant tools like Matlab or equivalent. |
The below snapshot shows the code snippet to plot data in MATLAB using the .CSV file
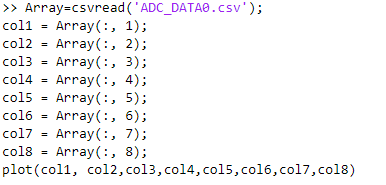
IQ Data Capture (90 degree phase shift between I and Q components)
...