Zynq-7000 AP SoC Benchmarking & debugging - Ethernet TechTip
Table of Contents
| Table of Contents |
|---|
Document History
| Date | Version | Author | Description of Revisions |
|---|---|---|---|
| 06/15/2015 | 0.1 | Upender Cherukupally | Release 1.0 |
Overview
This Techtip Tech tip explains the Ethernet debugging and benchmarking methods using the Zynq-7000 AP SoC
Zynq-7000 AP SoC has an in-built dual Giga bit Ethernet controllers which can support 10/100/1000 Mb/s EMAC configurations compatible with the IEEE 802.3-2008 standard. The Programming Logic (PL) sub system of the Zynq-7000 AP SoC can also be instantiated with the additional soft AXI EMAC controllers if the end application requires more than two Giga bit Ethernet Controller.
This techtip describes the step to use the PING utility, Wireshark network protocol analyzer, iperf and Netperf benchmarking tools. To follow these steps users can use the pre-built images available at following Xilinx resources:
- Zynq-7000 IEEE1588 PTP Design
- XAPP1026 - Zynq-7000 AP SoC Baremetal Reference Design
- XAPP1082 -Zynq-7000 Linux Ethernet Reference Design
This techtip tech tip explains the following sections:
- Creating the design for Zynq-7000 AP SoC with Ethernet using the Vivado and SDK
- Using the PING and traceroute utility
- Basic troubleshooting techniques for the link establishment
- Using the Wireshark network protocol analyzer
- NetPerf benchmarking utility for Linux based solution
- Iperf benchmarking utility for baremetal solution
Implementation
| Implementation Details | |
| Design Type | PS only |
| SW Type | Zynq-7000 AP SoC Linux & Zynq-7000 AP SoC Baremetal |
| CPUs | 2 ARM Cortex-A9: SMP Linux and Baremetal configurations |
| PS Features |
|
| Boards/Tools | ZC702 Kit & ZC706 Kit |
| Xilinx Tools Version | Vivado & SDK 2015.1 or latest |
| Other Details | - |
| Files Provided | |
| ZC702_ZC706_ReadyToUseImages | Contain folders: Source, SD Card Images required to follow the procedure below |
Creating the design for Zynq-7000 AP SoC with Ethernet using the Vivado and SDK
To follow the steps of trouble shooting and benchmarking you can also use the prebuilt images available in the above links or users can create their own design using the following procedure. If you want to run the prebuilt images then follow the procedure explained in the respected design and jump to the section ‘Using the PING utility’Step by Step Instructions
List all the steps to run the design. This includes hardware, software and tools needed.- Launch Vivado IDE Design Tool: Vivado 2015.1 or latest
On Windows 7, select Start > All Programs > Xilinx Design Tools > Vivado 2015.1 > Vivado 2015.1
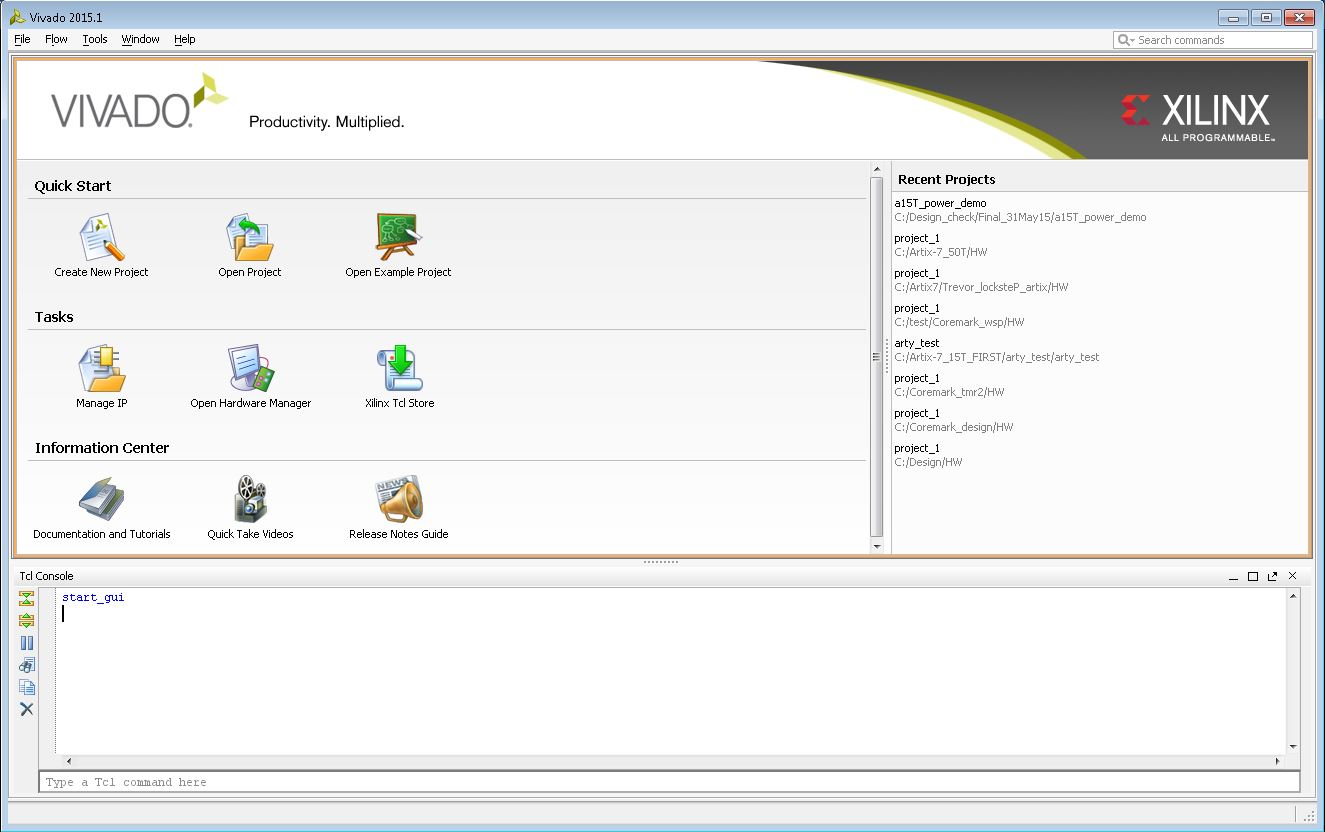 |
| Figure 1: Vivado IDE Launch |
3. In the Create a New Vivado Project window gives summary of further steps, click Next
4. In the Project Name dialog box, type the project name (e.g. Zynq_PS_GEM) and location. Ensure that Create project subdirectory is checked, and then click Next.
5. In the Project Type dialog box, select RTL Project and ensure that Don’t specify the sources at this time is checked then click Next.
6. In the Default Part dialog box select Boards and choose ZYNQ-7 ZC702 Evaluation Board or ZYNQ-7 ZC706 Evaluation Board. Make sure that you have selected the proper Board Version to match your hardware because multiple versions of hardware are supported in the Vivado IDE. Click Next.
7. Review the project summary in the New Project Summary dialog box before clicking Finish to create the project. Project summary window similar to Figure 2 will be opened
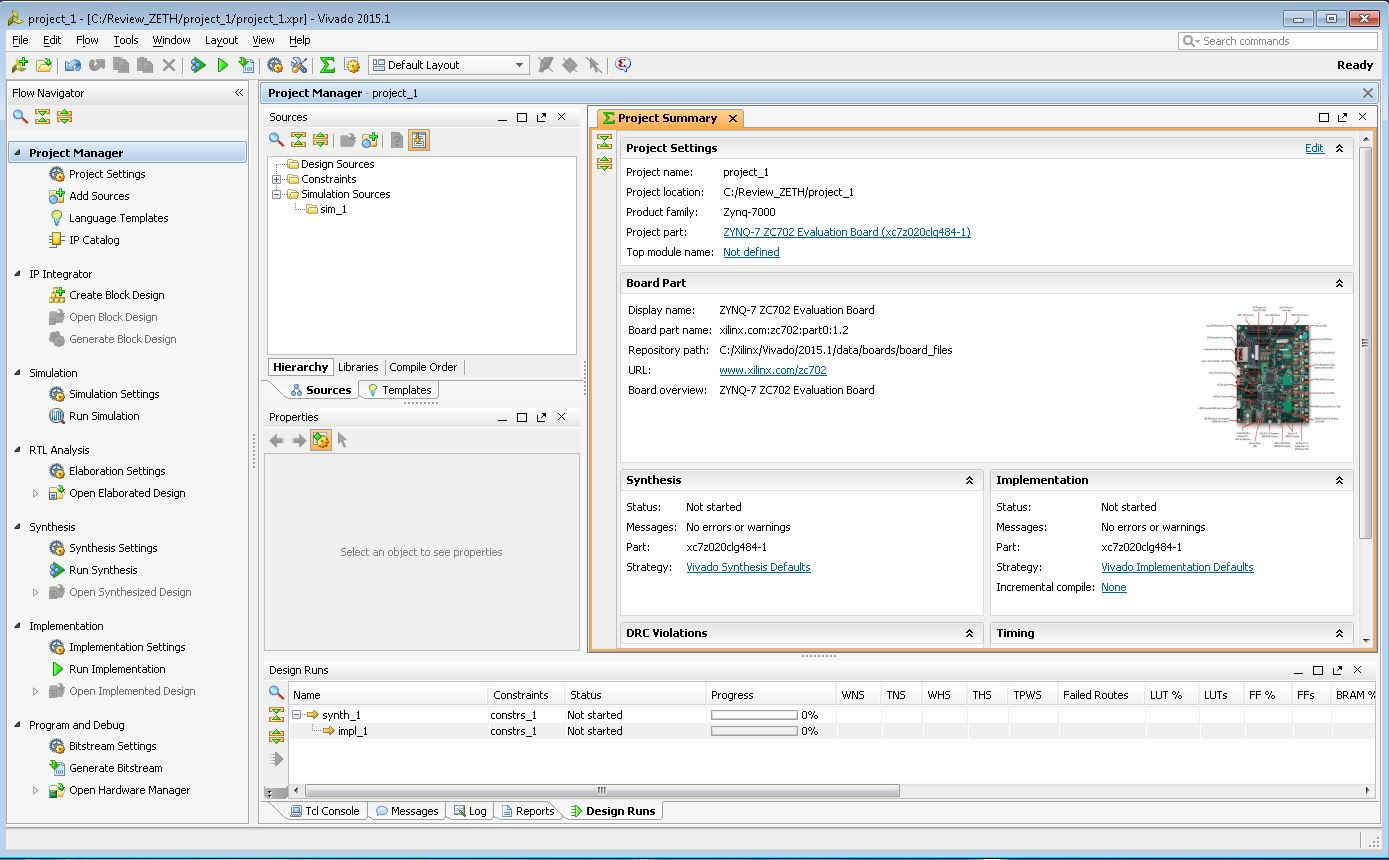 |
| Figure 2: Vivado Project Summary |
9. In the desing_1 drawing view select Add IP as shown in Figure 3 and select Zynq7 Processing System in the next pop-up search window
 |
| Figure 3: Adding IP to the block design |
 |
| Figure 4: Vivado Design block automation |
12. In next window select and connect the clock inputs as shown in Figure 5
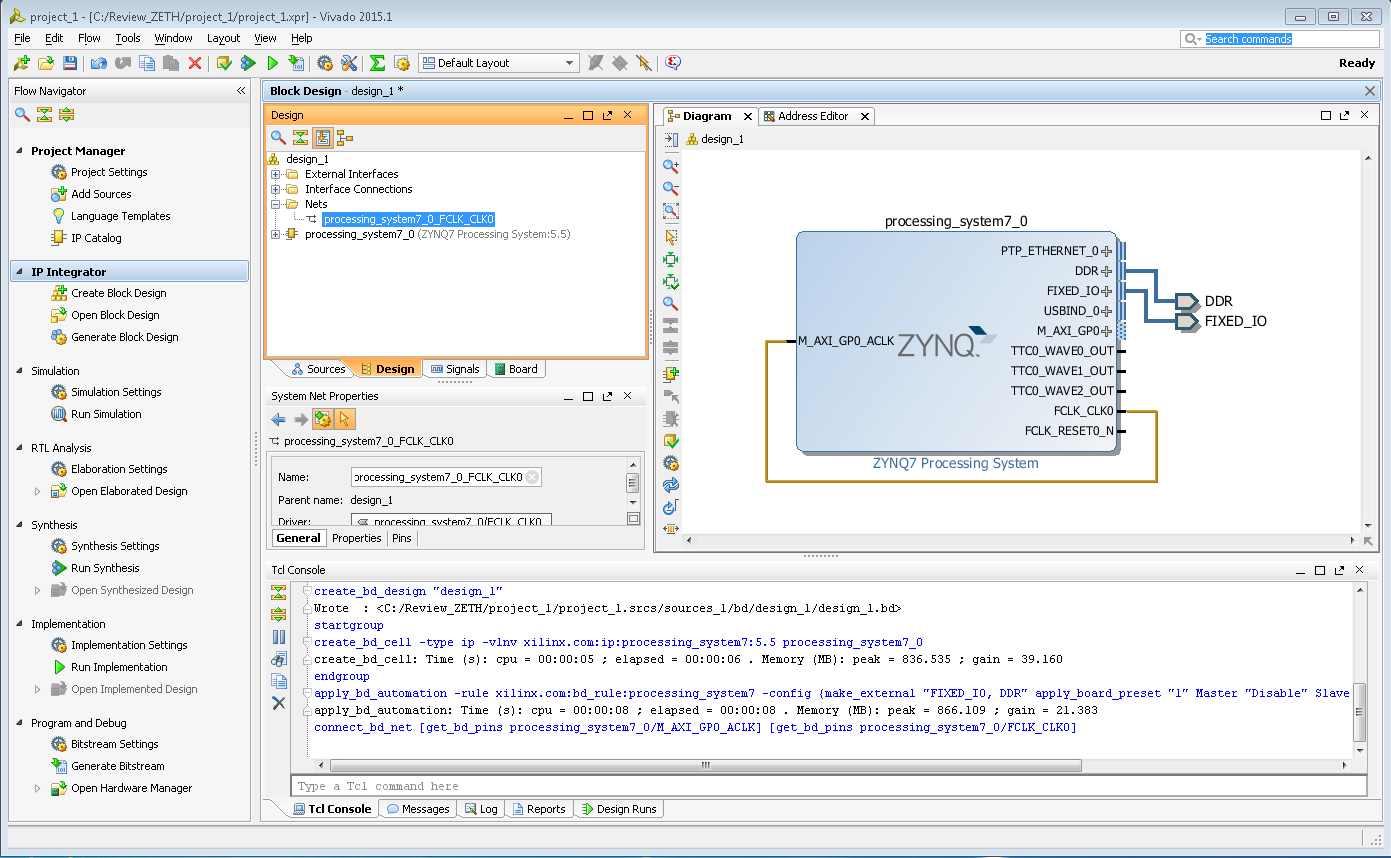 |
| Figure 5: Connecting the clock inputs |
14. Once generation is successful create the HDL wrapper as shown in Figure 6 and select the default option in next window pop-up
 |
| Figure 6: Creating HDL wrapper |
 |
| Figure 7: Exporting the HW to SDK |
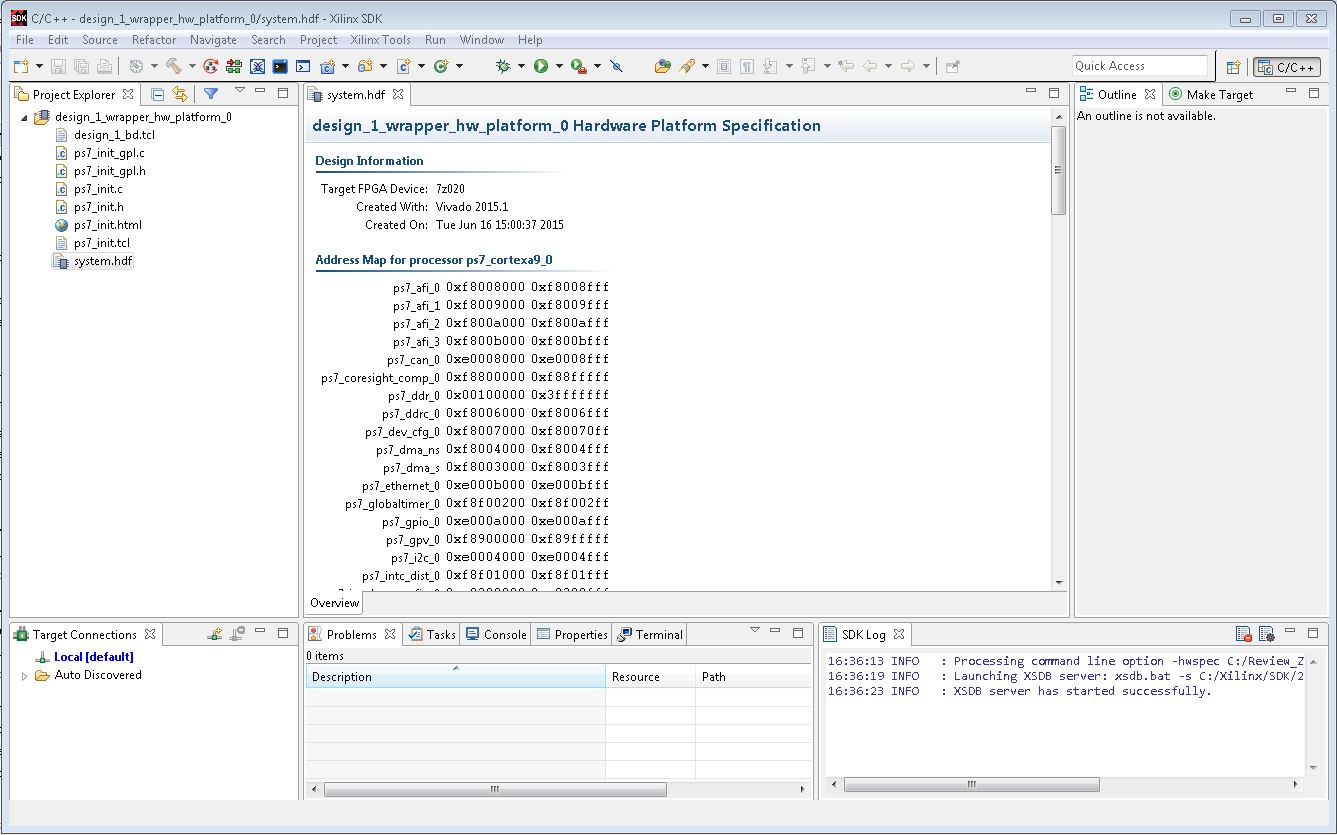 |
| Figure 8: SDK launch window |
17. Create a new application project to create the First stage boot loader (FSBL) as shown in the Figure 9
 |
| Figure 9: Launching the Application project |
19. In the Template wizard select Zynq FSBL and select Finish. Then SDK builds the Zynq FSBL if auto build is enabled
20. Next step is to create the boot.bin file. U-boot.elf file is also needed along with FSBL. Refer the Techtip on building u-boot or copy the u-boot.elf from the provided design files.
21. After the selections done as shown in Figure 10, in Create Boot Image wizard enter the name for BIF file and browse the directory paths for Zynq_FSBL.elf and u-boot.elf files then select Create Image button. Rename the output.bin file to boot.bin. Use this bin file in both the SD cards.
 |
| Figure 10: Creating the Zynq boot image |
23. To run the demo with provided pre-build images skip to step 22 or Follow the procedure explained in the wiki.xilinx.com web pages for getting the sources, building the U-Boot and Linux sources:
http://www.wiki.xilinx.com/Build+U-Boot#Zynq
http://www.wiki.xilinx.com/Build+Kernel#Zynq
24. To run the demo with pre-build images of the tis techtip or Images build in the above steps: Place all the required files in to SD card:
• Boot.bin
• uImage
• device-tree.dtb
• root file system Image(uramdisk.image.gz)
• NetPerf executables: NetPerf and NetServer
• iperf executables : iperf_arm
25. Connect the power supplies UART cable/PC to Zynq board, and connect the Ethernet ports of PC and Zynq7000 AP SoC with RJ45 cable
26. Power cycle the Zynq kit, once the Zynq boots the Linux enter the following commands
• Mount the SD card:
mount /dev/mmcblk0p1 /mnt
cd /mnt
27. Set the IP address for eth0 interface
zynq>ifconfig eth0 192.168.1.11
28. On Host PC set the static IP e.g. 192.168.1.10 for the LAN using the Local Area Connection properties
Using the PING:
The ping command is a very common method for troubleshooting the accessibility of devices. It uses a series of Internet Control Message Protocol (ICMP) Echo messages to determine:• Whether a remote host is active or inactive
• The round-trip delay in communicating with the host
• Packet loss
Usage on the command prompt: $ping <ip address of the target device to communicate with>
e.g. ping 192.168.1.10,
-t option is used for continuous ping messages: ping –t 192.168.1.10
Following the figure shows the ping usage for the Zynq eth0 set to static IP address 192.168.1.11 and host PC IP address set to 192.168.1.10
If there is no proper connection between host and Zynq kit then ping request will timeout/fail or will wait for the connection to establish
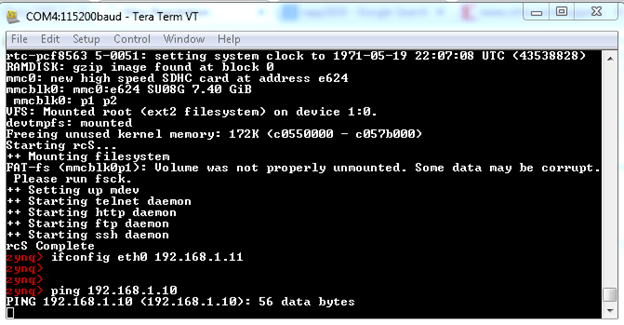
Figure 11: Setting the IP address to eth0 port and issuing the Ping command to the host

Figure 12: PING command request and response for successful connection/link
• the echo request gets to the destination, and
• the destination is able to get an echo reply back to the source within a predetermined time called a timeout
Basic troubleshooting techniques for the link establishment
Debugging Network Issues If any of the sample applications do not work, there could be several potential reasons. This section provides a troubleshooting guide to fix common sources of setup errors.- Ensure that the link lights are active. Most development boards have LEDs that indicate whether an Ethernet link is active. If the bitstream downloaded has some Ethernet MAC properly configured, and a Ethernet cable is attached to the board, the link lights should indicate an established Ethernet link.
- if the board includes LEDs indicating the link speed (10/100/1000 Mb/s), verify that the link is established at the correct speed. Confirm that the link speed that lwIP/software stacks detects matches the link speed as shown in the LEDs.
- To confirm that the board actually receives packets, a simple test is to ping the board and check to make sure that the RX LED goes High for a moment to indicate that the PHY actually received the packet. If the LEDs do not go High, then there are either ARP, IP, or link level issues that prevent the host from sending packets to the board.
- if user is using xilkernel+lwip/FreeRTOS+LWIP, Assuming that the board receives the packets, but the system does not respond to ping requests, the next step is to ensure that lwIP/software stack actually receives these packets. This can be determined by setting breakpoints at interrupt handlers like XemacLite_InterruptHandler for axi_ethernetlite systems, axi_dma_recv_handler for axi_ethernet systems, and emacps_recv_handler for Zynq-7000 AP SoC systems. If packets are received properly, then these breakpoints should be hit for every received packet. If these breakpoints are not hit, then that indicates that the MAC is not receiving the packets. This could mean that the packets are being dropped at the PHY. The most common reason that the breakpoints are not hit is that the link was established at a speed that the Ethernet MAC does not support.
Using the Wireshark network protocol analyzer
Wireshark is a network protocol analyzer tool display the Ethernet protocol packets information in user readable format. This tool can be downloaded from https://www.wireshark.org/The more information on how to install and how to capture, analyze the real time packet data user can refer to http://www.howtogeek.com/104278/how-to-use-wireshark-to-capture-filter-and-inspect-packets/
Step 1: Once the host PC is installed with the wireshark utility then launch the wireshark, opening page will appear as shown in the following figure:
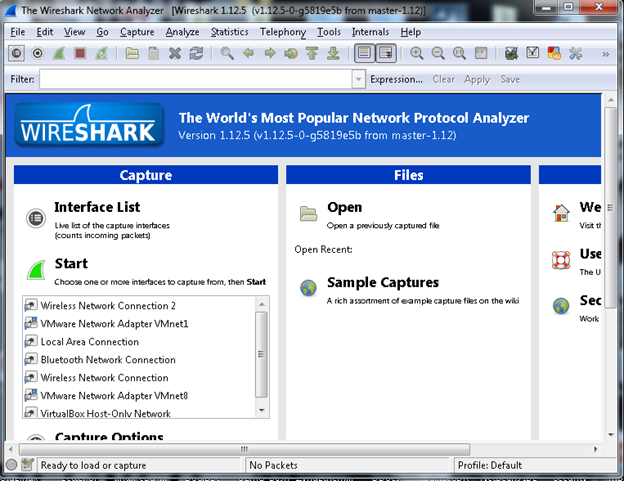
Figure 13: Wireshark launch example
Step 2: Select the interface on which the packets are to be inspected/debugged. Here in this example the Local Area Connection is used to interface between host PC and Zynq kit so select the ‘Local Area Connection’ as shown in the following figure:
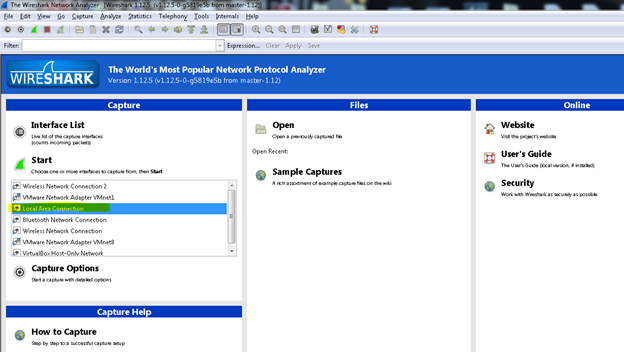
Figure 14: Selecting the link for analysis
Step 3: Select the start button as shown in the following figure:

Figure 15: Network analysis Start option
Step 4: Once the proper connection is established and start selected on the analyzer then analyzer will capture and display all the packets transfers happening on this interface. The example log is displayed there where it is showing continuous ping and response to pin command which is started in the previous section. User can inspect this log and analyze if there are any issues
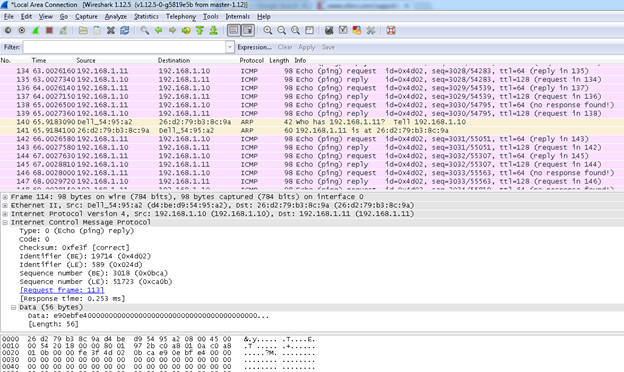
Figure 16: Wireshark log for analysis
Benchmarking
There are industry standard tools like NetPerf and iperf/jperf which run as an application layer on top of the communication stack for the Ethernet benchmarking. These tools provide the throughput or performance of the device which transmits and/or receives the Ethernet packets.NetPerf benchmarking utility for Linux based solution
NetPerf is a network benchmarking tool that can be used to perform the Ethernet Benchmarking. Following are the two major types of these tests
- TCP and UDP unidirectional streaming bandwidth test using standard Sockets interface
- TCP and UDP request/response latency test using standard Sockets interface
Options:
- -h - Specify the host (netperf server) to connect to for testing
- -l - Specify duration (length) of test to be performed
- -t - Specify the protocol used:
- TCP_STREAM - High-bandwidth TCP streaming test from client to server. Results is bandwidth measurement (Mbit/sec)
- TCP_MAERTS - High-bandwidth TCP streaming test from server to client (MAERTS is STREAM backwards)
- UDP_STREAM - High-bandwidth UDP streaming test from client to server
- UDP_MAERTS - High-bandwidth UDP streaming test from server to client
- TCP_RR - Request/response test - TCP "ping" from user-space client to user-space server, and back again. Result is not elapsed time per "ping", but rather average number of "pings" per second.
- UDP_RR - Request/response test - UDP "ping" from user-space client to user-space server, and back again
NetPerf outbound test procedure:
In the outbound tests Zynq-7000 AP SoC will be working as a client and host PC will be working as a server.Before executing the following netperf commands make sure the target host PC is running the netserver utility by using the following commands
a. Set the IP address for eth0 interface on the host pc as
- #ifconfig eth0 192.168.1.11
- #taskset 2 netserver
On the Zynq linux command prompt:
a. To run the netperf for UDP/IP benchmarking with packet size 1400 bytes and targeted PC address 192.168.1.10 use the following command
- #taskset 2 ./netperf -H 192.168.1.10 -t UDP_STREAM -c -- -m 1400
- #taskset 2 ./netperf -H 192.168.1.10 –c
NetPerf Inbound test procedure:
In the inbound tests Zynq7000 AP SoC will be working as a server and host PC will be working as a client.To run the NetServer execute the following command at the Zynq Linux prompt:
- #taskset 2 ./netserver
On the Host PC:
a. To run the netperf for UDP/IP benchmarking with packet size 1400 bytes use the following command
- #taskset 2 netperf -H 192.168.1.20 -t UDP_STREAM -c -- -m 1400
- #taskset 2 netperf -H 192.168.1.20 –c
iPerf Benchmarking:
iperf is a network benchmarking utility like Netperf. For more details on usage and utility refer: https://iperf.fr/iperf for Zynq kit is available for baremetal software running on the Zynq. Use the design files and procedure explained in the XAPP1026 for Zynq to run the iperf benchmarking. Following is the command sequence need to be used to get the performance numbers:
Receive Throughput Test Procedure
To measure receive throughput, connect to the receive iperf application using the iperf client by issuing the iperf -c command with relevant options. A sample session (with zc702_GigE as reference) is as follows:- C:\>iperf -c 192.168.1.10 -i 5 -t 50 -w 64k
- Client connecting to 192.168.1.10, TCP port 5001
- TCP window size: 64.0 KB
- [ 3] local 192.168.1.100 port 51644 connected with 192.168.1.10 port 5001
- [ ID] Interval Transfer Bandwidth
- [ 3] 0.0- 5.0 sec 562 MBytes 944 Mbits/sec
- [ 3] 5.0-10.0 sec 563 MBytes 945 Mbits/sec
- [ 3] 10.0-15.0 sec 562 MBytes 942 Mbits/sec
- [ 3] 15.0-20.0 sec 563 MBytes 945 Mbits/sec
- [ 3] 20.0-25.0 sec 561 MBytes 941 Mbits/sec
- [ 3] 25.0-30.0 sec 564 MBytes 945 Mbits/sec
- [ 3] 30.0-35.0 sec 558 MBytes 935 Mbits/sec
- [ 3] 35.0-40.0 sec 562 MBytes 942 Mbits/sec
- [ 3] 40.0-45.0 sec 561 MBytes 941 Mbits/sec
- [ 3] 45.0-50.0 sec 563 MBytes 945 Mbits/sec
- [ 3] 0.0-50.0 sec 5.49 GBytes 943 Mbits/sec
Transmit Throughput Test Procedure
To measure the transmit throughput, start the iperf server on the host, and then run the executable on the board. When the executable is run, it attempts to connect to a server at host 192.168.1.100. This address can be changed in the txperf.c file. A sample session (with zc702_GigEas reference) is as follows:
- C:\>iperf -s -i 5 -w 64k
- Server listening on TCP port 5001
- TCP window size: 64.0 KB
- [ 4] local 192.168.1.100 port 5001 connected with 192.168.1.10 port 49153
- [ ID] Interval Transfer Bandwidth
- [ 4] 0.0- 5.0 sec 485 MBytes 814 Mbits/sec
- [ 4] 5.0-10.0 sec 485 MBytes 814 Mbits/sec
- [ 4] 10.0-15.0 sec 481 MBytes 807 Mbits/sec
- [ 4] 15.0-20.0 sec 481 MBytes 807 Mbits/sec
- [ 4] 20.0-25.0 sec 485 MBytes 814 Mbits/sec
- [ 4] 25.0-30.0 sec 485 MBytes 814 Mbits/sec
- [ 4] 30.0-35.0 sec 484 MBytes 812 Mbits/sec
- [ 4] 35.0-40.0 sec 480 MBytes 806 Mbits/sec
- [ 4] 40.0-45.0 sec 484 MBytes 812 Mbits/sec
- [ 4] 45.0-50.0 sec 482 MBytes 809 Mbits/sec
- [ 4] 50.0-55.0 sec 480 MBytes 806 Mbits/sec
^C
Press Ctrl+C twice to stop the server.
For EthernetLite based systems, use a TCP window size of 8k instead of 64k to get maximum performance numbers.
Conclusion
This techtip covered all the major debugging and benchmarking techniques for the Ethernet protocol. This techtip explains all the steps to use these tools for the Ethernet based solutions using the Zynq-7000 AP SoC. There are few other software tools like EEMBC etc for Ethernet benchmarking, refer to the respective web pages for more detailed information which are not covered in detailed in this techtip.