Zynq-7000 AP SoC Spectrum Analyzer part 7 - Building and Running a QT based GUI Tech Tip 2014.3
Zynq-7000 AP SoC Spectrum Analyzer part 7 - Building and Running a QT based GUI Tech Tip 2014.3
Table of Contents
Document History
| Date |
Version |
Author |
Description of Revisions |
|
| 1 November 2014 |
1.0 |
Faster Technology |
Initial posting |
|
| 14 April 2015 |
1.1 |
Faster Technology |
Final review and posting |
|
| Date |
Author |
Comment |
||
|---|---|---|---|---|
Description/Summary
In the Tech Tip "Zynq-7000 AP SoC Spectrum Analyzer part 1 - Accelerating Software and More - Installing and Running the Spectrum Analyzer Demo Tech Tip 2014.3" a Graphical User Interface (GUI) based demonstration of signal processing on the Zynq-7000 AP SoC device using the ZC702 Development Platform was shown. This Tech Tip illustrates how that GUI was developed.
A significant advantage of the ARM Cortex A9 processors contained in the Zynq-7000 AP SoC family of devices is the rich infrastructure from many different vendors that surrounds the processor. This includes support for GUI and application development using the Qt cross platform application and UI framework provided through the Qt Project (www.qt-project.org). Qt is available both as a commercially supported product and as an open source project governed by an inclusive meritocratic model. For the purposes of this Tech Tip, the open source version is an appropriate choice. If users subsequently choose to build a commercial application using Qt is is strongly suggested that they obtain a commercial license.
Development of a GUI application using Qt uses a graphical drawing toolbox and a collection of widgets to provide various interactions with the user. These include a variety of input mechanisms (drop down menus, radio or check box selections, numeric or text entry and so forth) as well as both static and dynamic output drawing capabilities. In this Tech Tip, a few of these will be illustrated based on the demonstration GUI mentioned above. Using the basic techniques illustrated, the user can readily see how more complex systems can be built using the Zynq-7000 AP SoC as the basic engine for a GUI intensive application. In this demonstration, one CPU will be dedicated to the GUI operations while the second CPU is used for processing the FFT data. This ability to bind the CPUs to separate software is a key to providing the level of user interaction desired for modern GUIs.
Implementation
| Implementation Details |
|
| Design Type |
PS & PL |
| SW Type |
PetaLinux |
| CPUs |
1 CPU - standard ZC702 frequency for GUI; second CPU for FFT processing |
| PS Features |
ARM processor with standard peripherals used by PetaLinux |
| PL Cores |
Video processing and display cores used in Base TRD 2014.2; HW FFT and XADC input |
| Boards/Tools |
ZC702 with monitor, keyboard, mouse and other I/O devices used with the base TRD / Linux platform with Centos 6.5 |
| Xilinx Tools Version |
Vivado 2014.2, Qt 4.7.3, Qwt 6.0.1, Qt Creator 3.2.2, ZC702 Base TRD 2014.2 |
| Other Details |
ZC702 setup for console terminal and Ethernet required |
| Files Provided |
|
| **signal_analyzer_gui.zip** |
Project files for SDK |
Block Diagram
The Qt based GUI manages all of the interactions between the user and the separately operating FFT Application. These include:
- Mouse pointer tracking and click detection
- Processing actions based on mouse clicks; menu selections, etc.
- Display output
- Static messages (title header, etc.)
- Menus and selected menu items
- Sample data plot
- FFT output plot
- CPU usage plot
- AXI bus bandwidth plot
- Time to compute, Performance, CPU loading, Bus loading displays
The Qt system is based on a rich library of components that adhere to an underlying structure so they can all be used together to build a gui using either a graphical environment such as Qt Designer or Qt Creator, or through use in user generated software. The use of a graphic environment to build the gui simplifies getting the basic structure working while enabling the user to add their own functions that operate behind the scenes from information exchanged with the gui.
For the purposes of this Tech Tip, we are using 3 types of elements in the gui:
- Static display items
- Event processing or display items
- Data driven display items
Static display items are elements of the gui that do not change. This might be the main title of a screen, the title of some portion of the screen (CPU usage: display area for example) and other elements that do not change based on user input or data generated by the FFT processing.
Event processing and display items are those elements of the gui that interact with the user. These are generally mouse tracking and clicking for specific input selection, such as drop down menu items or radio selection buttons. Some of these will result in changes in the display, such as the display of the Help dialog box when the Help button is clicked.
Data Driven display items are those portions of the gui that display output results from the underlying FFT processing or information from system operation such as the CPU usage. For these elements, various plotting capabilities within the Qt environment are used, with parameters determined from the FFT data or user input.
Each of these will be briefly reviewed in the subsequent "Step by Step Instructions" section. More information of the Qt system and the many included capabilities can be found at the Qt Project (www.qt-project.org) This Tech Tip is NOT intended to educate the user on all of the intricacies of the Qt system but to illustrate some of the aspects of how it was used for this project.
Step by Step Instructions
The prior Tech Tips in this series have been developed and demonstrated using the Windows based Vivado tools; Vivado and SDK 2014.3 specifically. For the GUI development, the base TRD is only available for PetaLinux where the development environment (PetaLinux SDK) only operates in a Linux environment. Therefore, the GUI development must also be done on Linux as it interacts with elements of the TRD that are already in place, including the video drivers, frame buffer interactions, display and peripherals drivers and so forth. For this Tech Tip, the development was done on 32 bit Centos 6.5 final release Linux, operating on a virtual machine using VirtualBox on a Windows host. The version of VirtualBox was 4.3.18. Note that there are newer versions of both the VirtualBox environment and the Linux guest Operating System; use of these is at the user's discretion.
Install and Test the Qt environment
The first step is to install and test the underlying tools that are required.
NOTE:
If you have the development environment used for the Tech Tip "Zynq-7000 AP SoC Spectrum Analyzer part 5 - Accelerating Software - Accelerating an FFT with ACP Coprocessor Tech Tip 2014.3"
then the following installation steps for Petalinux and Qt / Qwt can be skipped. Simply proceed with unzipping the TRD.
Download the Petalinux based TRD for the 2014.2 tools release based on the instructions at http://www.wiki.xilinx.com/Zynq+Base+TRD+2014.2
With the TRD downloaded, follow the instructions in section 5 of the wiki article to download and install the Petalinux SDK on an appropriate Linux platform.
Follow the instructions in the wiki page "Zynq Qt and Qwt Base Libraries-Build Instructions" to install Qt and Qwt on the Linux platform. When this is completed, download and install either the Qt Designer or Qt Creator tool. Either of these can be used to manipulate the display screen setup using a simple graphical methodology. Information and download of the version of Qt Creator used for this Tech Tip can be found here http://download.qt.io/official_releases/qtcreator/3.2/3.2.2/ Qt Designer is installed as part of the installation of the Qt System on the specific platform where it will be run. Various platform versions for the revision used in this Tech Tip can be found at http://download.qt.io/archive/qt/4.7/ More information on Qt Designer can be found at http://doc.qt.io/qt-5/qtdesigner-manual.html.
NOTE:
When choosing either Qt Designer or Qt Creator, select one of the older versions (such as the Qt Creator noted above) that is based on the 4.X release. Newer versions that are based on the 5.X releases are not compatible with the older Qt system used here. The wiki pages for Qt have information on the key differences between those major versions. For the purposes of this Tech Tip, the key difference is that the 4X version includes a simple windowing system that is not supported in the 5.X versions.
Unzip the TRD to a convenient location on your Linux platform and verify the file structure and contents against the diagram in Section 1 of the Zynq Base TRD wiki article.
With these elements in place, a simple test that the environment is operating correctly is to build the TRD graphics elements.
CAUTION:
There are a number of environment variables that must be set properly for the Qt gui system of the TRD to build properly. If there are any issues with getting these set properly, the following section on building the signal analyzer gui may provide insights to get them to build properly.
To test the installation by building the projects within the TRD,
Right click on each project and select Build. Each project should build clean.
Build the signal analyzer GUI
Download the signal_analyzer_gui project zip file from the link provided. Save it to a convenient location on your Linux platform. This project supplements the Qt graphics and video that are already in the Petalinux base TRD. SDK will be used to import the project and build it. The resulting executable file will then be added to a file set that performs the overall signal analyzer demonstration as seen in the Tech Tip "Zynq-7000 AP SoC Spectrum Analyzer part 1 - Accelerating Software and More - Installing and Running the Spectrum Analyzer Demo Tech Tip 2014.3". The additional files are the same as the set of executables and boot files saved at the end of the Tech Tip "Zynq-7000 AP SoC Spectrum Analyzer part 6 - AMS - XADC Signal Acquisition and DMA to L2 Cache & Complete Design Tech Tip 2014.3". If the user does not have the workspace or files from completion of part 6 of this Tech Tip series, it is easier to use the demonstration files and simply add the modified GUI.
Be sure that Vivado / SDK 2014.2 is installed and working properly on the Linux host system per the implementation table above.
Create an empty folder to contain the signal analyzer projects. In our case we created a "signal_analyzer_gui" folder within our "projects" folder.
From a terminal console where SDK will be started, execute the following to set up SDK and environment variables required for proper operation.
source /opt/Xilinx/SDK/2014.2/settings32.sh
export ZYNQ_QT_INSTALL=/opt/pkg/qt/install
export ZYNQ_TRD_HOME=/path/to/TRD
export CROSS_COMPILE=arm-xilinx-linux-gnueabi-
export MISC=${ZYNQ_TRD_HOME}/software/prebuilt
This assumes that the host Linux Platform is a 32 bit platform. If it is a 64 bit platform, use the 64 bit version of the settings file in the same directory.
The ZYNQ_QT_INSTALL shown here is where the default installation noted earlier and used in the wiki page instructions will place the Qt system. If the user has installed Qt in another location, use that location to set the environment variable.
ZYNQ_TRD_HOME is simply the starting directory where the TRD has been unzipped. This is generally in the user's working directory space. This must contain all of the sub-directories supplied with the TRD as there are items in various locations in the TRD required for proper building of the signal analyzer gui.
CROSS_COMPILE tells the Qt tool chain and make system which compiler to use for cross compiling to target the Zynq-7000 AP SoC and Petalinux.
MISC enables the tool chain to locate elements of the Petalinux system that are provided with the TRD
From the same terminal window, start SDK with the following
xsdk &
SDK will then start.
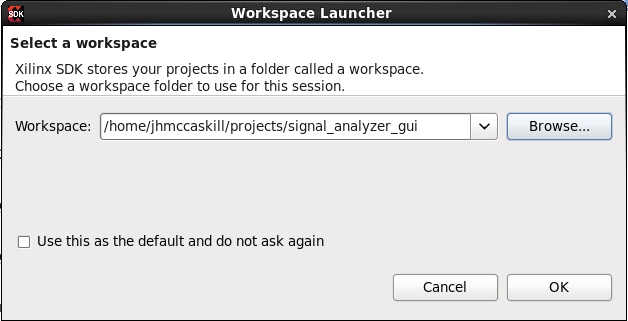
From the workspace launcher, click Browse and navigate to the empty folder set up for the signal analyzer gui project. In our case this is $HOME/projects/signal_analyzer_gui
Verify that the location is correctly entered in the Workspace: entry box and click OK.
SDK will start.
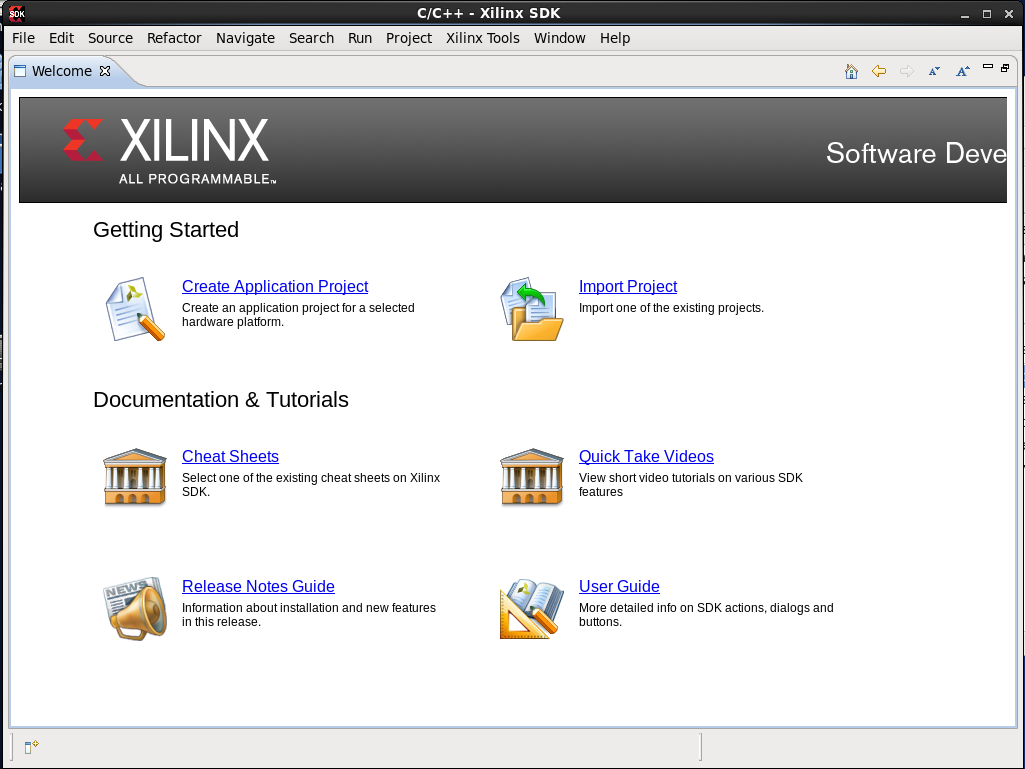
If the Welcome screen is displayed, simply click the x in the screen tab to cancel it.
SDK will then start with the workspace selected. Because there is nothing in the folder at this time, SDK will start with a blank Project Explorer pane.
Import signal_analyzer_gui projects
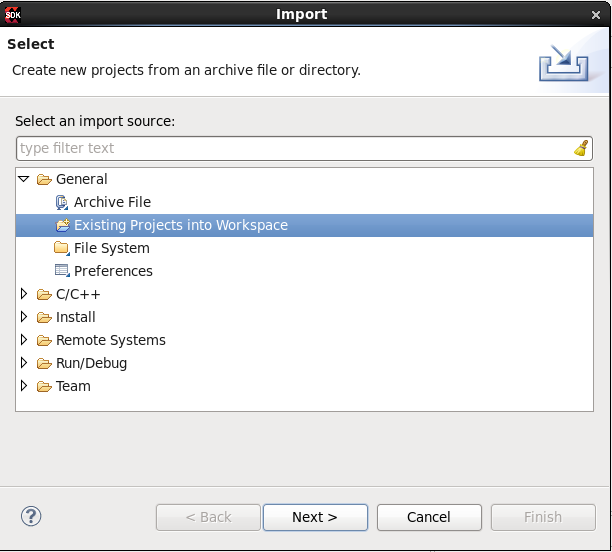
Right click in the blank space of the Project Explorer pane (or select File > Import from the menu bar), expand the General line, select "Existing Projects into Workspace" and click Next
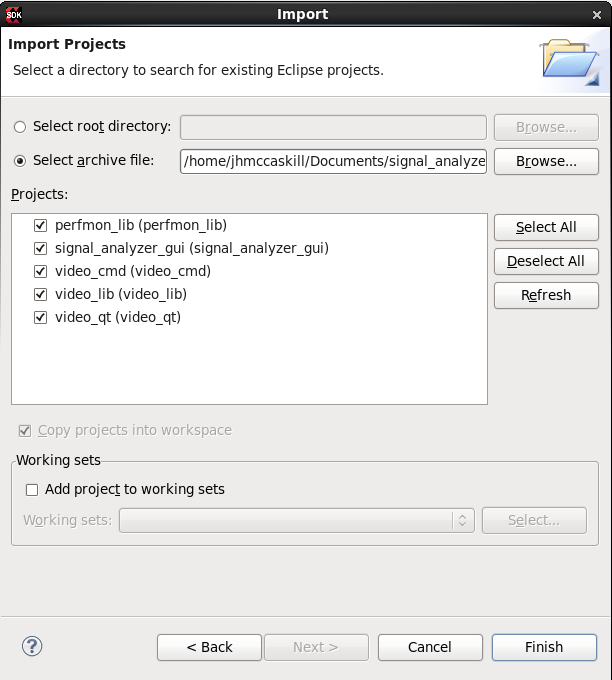
Click the Select archive file button in the top left of the dialog box and then navigate to the location where the signal_analyzer_gui.zip file was saved, select the file and click OK.
Verify that there are 5 projects as shown below, then click Finish.
The projects will be imported into SDK and are ready to be used.
Test project import process
To verify that the import process worked properly, and that all of the environment variables are set correctly, it is best to build the complete set of projects.
From the menu bar, select Project and look at the Build Automatically selection. If the box is checked, un-check it. Then select Project > Clean.
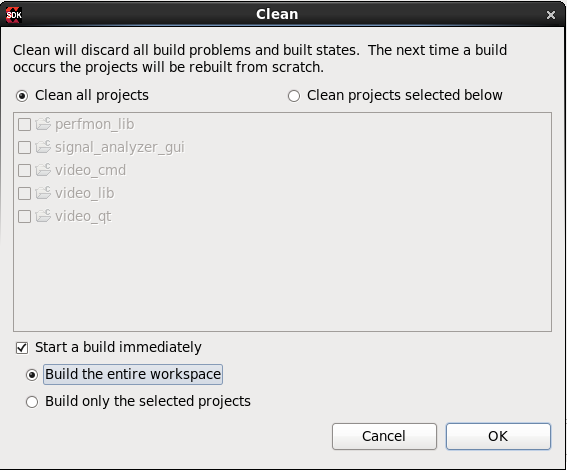
When the Clean dialog box appears, be sure the "Clean all projects" button is checked, the "Start a build immediately" option is checked and the "Build the entire workspace" button is checked. Then Click OK.
SDK will then clean all of the projects and build them. There will be some warnings, but these can be ignored for now. If there are any errors, this indicates that there is some issue with either the setup prior to starting SDK, or a problem with the original Qt system installation.
Making GUI changes
The previously installed Qt Designer or Qt Creator tool will be used to examine the display screen definition and show how a change is readily made and built into the working GUI. In our case, we used the Qt Designer tool.
Start Qt Designer either from the command line in a terminal or from the icon installed on your Linux desktop, typically in Applications > Programming > Qt4 Designer.
Note: We are using Qt Designer based on the 4.X release of the Qt system for the reason noted earlier.
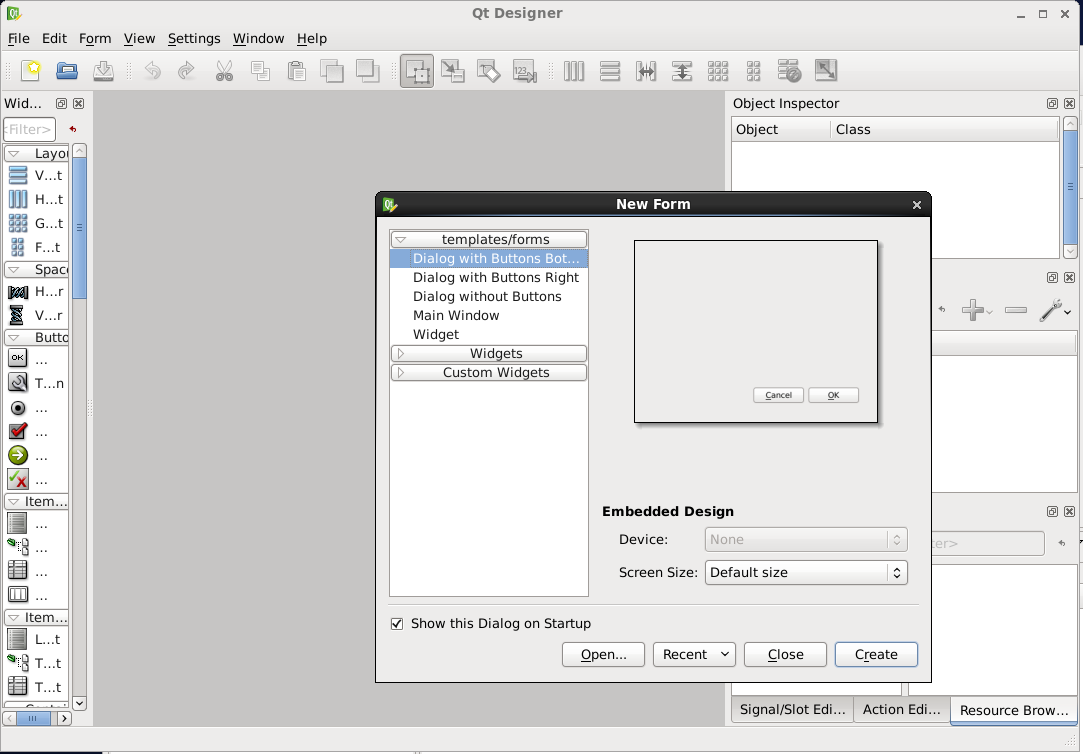
When Qt Designer starts, Click Open in the New Form dialog box so we can open the gui definition that is supplied with the signal_analyzer_gui project.
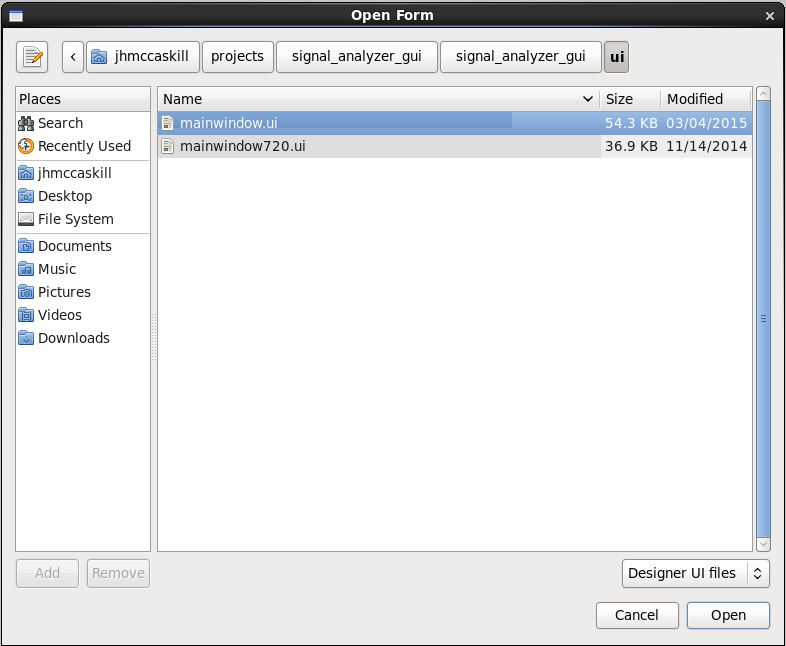
In the Open Form dialog box, navigate to the location where the signal analyzer gui projects are located - BE SURE THIS IS THE SAME FOLDER USED BY SDK - and open the signal_analyzer_gui folder and then the ui folder. Select the mainwindow.ui file as shown below and click Open.
NOTE: The mainwindow720.ui file is not used for this Tech Tip - it is an alternate window size for the graphics used in the TRD.
The main screen layout for the signal analyzer demo will be displayed. The default is to show the upper left portion of the layout if the screen area is limited or if the layout is for a larger screen (more pixels in either direction) than the actual screen being used.
As noted earlier, there are 3 different types of elements used in the definition of the signal analyzer display: static display items, event processing or display items and data driven items. We will look at each of these in more detail to show how the layout items relate to the application and how easy it is to use the Qt system to add items to the layout. All items with the exception of the static display items have common naming between the layout in Qt Designer (or Qt Creator) and the user application within the mainwindow.cpp program in the SDK signal_analyzer_gui project.
Data driven display items:
If we look at the signal analyzer demo, the top portion of the screen, immediately below the command selection area, is dominated by display of the input waveform. If we click on the blank area with the light bounding line in the Qt Designer layout, the area gets sizing handles and the right side of the Qt Designer screen contains information on the item selected.
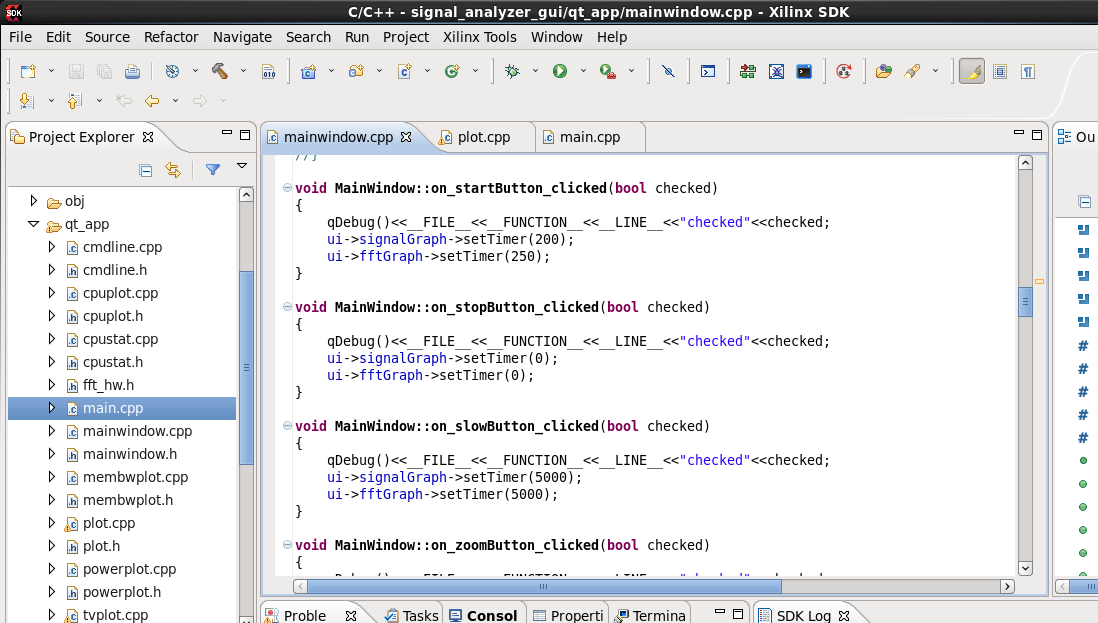
The object selected has the name signalgraph and is driven by the program "plot". It is 1890 by 330 pixels and starts at location 10, 110 where 0, 0 is the upper left corner of the layout of the screen. Actions in the application software that relate to the "signalgraph" object operate on this layout area of the screen. For example, from SDK, we can look at the mainwindow.cpp source and see a couple references to signalgraph.
These are setting a timer function based on buttons in the gui that are clicked. For example "startbutton" is the named object in the upper left corner of the layout that allows the user to start the display if it is stopped. In a similar manner, "stopbutton" halts the timer so the display never gets updated.
"stopbutton" is a QPushButton object that is one of the standard Qt widgets so no specific user codes is needed; user actions on it can be used directly in the application program.
Further examination of the source for plot.cpp will show how the input signal information in the signal analyzer demonstration gets plotted using some of the standard Qt functions.
Two additional data driven items are the "CPU Usage" and "Axi Bus Bandwidth Usage" displays. These are controlled by cpuplot.cpp and membwplot.cpp respectively.
Event processing or display items:
Event processing or display items are those that do not change based on the information in the from the application. These are mainly the control buttons and their related display. For example, if we select the area near the "Sample Rate control in the upper middle of the layout, we can examine how this element of the layout relates to the underlying application and user changes get reflected in the operating software.
With the Sample Rate area selected, double click on the box that contains the number representing the "K Samples/sec". An additional information dialog will appear.
The items in the Edit Combobox dialog are what will be displayed and enable the user to select them. This is a standard Qt widget called QComboBox that has the characteristics listed in the Property area on the right side of the screen. The operation of the QComboBox provides an index value with the name samplerate when the user selects an item. For example, if the user selects the value "100" from the drop down list that the QComboBox presents, samplerate will be set to 2.
Click the Cancel button to close the Edit Combobox dialog.
From within the mainwindow.cpp program we can see how this is used.
"index" is passed the value from the QComboBox for samplerate and is then used to assign an appropriate value to the variable "val" that is part of the data structure used to pass information from the gui to the underlying application software. We can see that a user selection of "100" for the Sample Rate sets samplerate to 2 which is then passed to index. Within the case statement, an index value of 2 sets val to be 100.
The other controls have similar linkages from the gui layout and underlying widgets to the gui control software in mainwindow.cpp or similar (plot.cpp for example) portions of the SDK project.
Static display items:
Static display items are those elements of the display that do not change. These include the "Welcome" notice in the upper left corner of the display, lines which define specific areas of the screen, and other labels, etc.
As an example of adding an item to the gui layout and to demonstrate the other steps in building the overall gui, we will add another static display item to the layout, build the gui and show the label on the signal analyzer demo screen.
With the mainwindow.ui screen scrolled so the upper right portion of the screen is visible, scroll down the Widget Box on the left side of the screen to the group of Display Widgets. Click on the Label widget and drag it onto the layout portion of the screen, dropping the resulting "Text Label" item in the upper right portion of the layout.
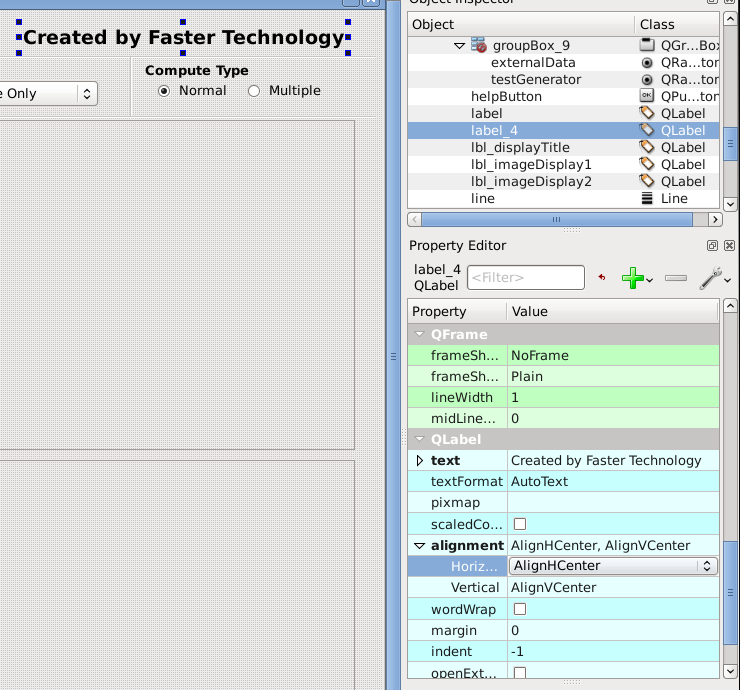
Double click on the text in the highlighted box and change it to something you would like to display in this area. We changed it to "Created by Faster Technology". Grap the handles on the text box to expand the box to allow all of the text to be displayed. You can also click the box and drag it to position it within the blank area in the upper right corner of the layout.
The properties of the text box can be changed through the Property area on the right side of the display. We changed the text to 14 point font and selected the Bold option. To change the Font size, click on the Font line and use the optional dialogue box to change the size (you can also change the font, the font style and other attributes) or click the Point Size line and select or enter a new value. We also changed the font type to be a simple Sans Serif font.
To make it easier to position the text in the blank area, we changed the alignment options. Scroll down the Property area on the right side of the screen to the QLabel portion. Expand the alignment item to reveal the two options and set them to AlignHCenter and AlignVCenter. This centers the text in both the horizontal and vertical directions.
With the change made, we are ready to build and test the revised gui layout.
From the main menu bar, select File > Save All. Qt Designer (or Qt Creator) can now be closed if desired.
Building and Testing GUI Changes:
During the time we were reviewing the layout of the gui, discussing the various elements and making the change, SDK was still open and running. If you had closed SDK, start it again, navigate to the location where the signal_analyzer_gui projects were previously built and be sure they are properly loaded into SDK.
Saving the changes to the gui resulted in all of the underlying Qt files being updated. These will all be built again if we simply build the signal_analyzer_gui project.
In the Project Explorer pane, right click on the signal_analyzer_gui project and select Clean Project. When that has finished, right click on the signal_analyzer_gui project and select Build Project.
We are now ready to test the revised gui to see our change.
To test the gui, you must have a ZC702 set up to run the spectrum analyzer demonstration as described in the Tech Tip "Zynq-7000 AP SoC Spectrum Analyzer part 1 - Accelerating Software and More - Installing and Running the Spectrum Analyzer Demo Tech Tip 2014.3".
If the demo is set up to run, return to that Tech Tip and set up the ZC702 and be sure it operates as described.
The simplest means of testing the gui change is to replace the signal_analyzer_gui executable program on the SD card with the new one.
Be sure the ZC702 is powered off and remove the SD card.
Using an appropriate SD card media device, verify that it has the following files and folders.
Copy the new signal_analyzer_gui executable program to the SD card. It is a good idea to rename the existing executable program of the same name before replacing it with the new one.
Remove the SD card from the media device, insert it into the ZC702 and turn on the power to the ZC702. The demonstration should run as before with the new label in the upper right corner as shown below.
It is also possible to use RSE to test the change we made.
From the running SDK, we can use Remote System Explorer to change the graphics software on the demo and verify that the change is in place.
NOTE:
As noted in other Tech Tips, the default IP address of the ZC702 when running Petalinux is different from when running OSL. The default IP address with Petalinux is 192.168.0.10. For some network setups, this IP address may not be reachable from the Linux platform where SDK is currently running. If that is the case, you can start the ZC702 and use a console terminal (with the USB serial console connection and a terminal emulator such as Tera Term) to change the IP address to something that is reachable on your network. In our case, we used this technique and the ifconfig utility to change the IP address to 192.168.1.65 - an address that we know we can reach.
From the main menu bar of SDK, select Window > Open Perspective > Other then select Remote System Explorer and click OK.
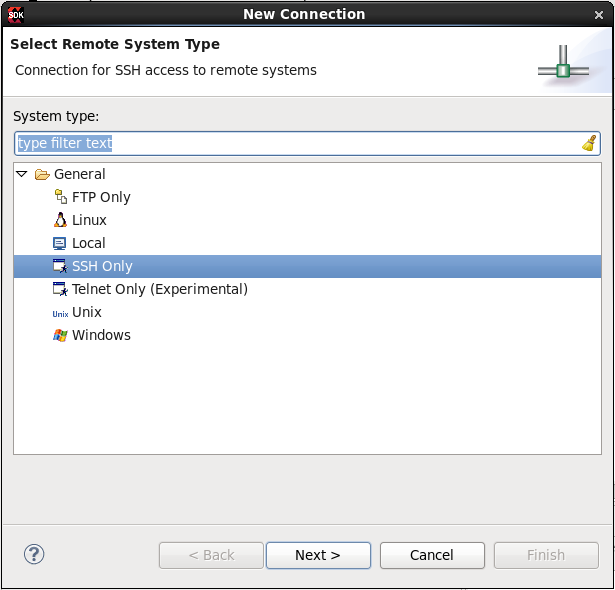
Right click on the blank space in the Remote Systems pane and select New > Connection.
In the New Connection dialogue, select SSH Only and click Next
Change the Host name: entry in the New Connection dialog to the IP address of your ZC702 - in our case this is 192.168.1.65. Then click Finish.
In the Remote Systems pane, right click on the Ssh Terminals item under the IP address of your ZC702 and select Launch Terminal.
If you are presented with a login box, use the username root and password root.
A terminal window in SDK will be created. For ease of viewing, it may be best to maximize the terminal so it occupies all of the SDK window.
Because the demonstration is currently running, RSE will not be able to copy the new version of the signal_analyzer gui to the ZC702. To run signal_analyzer_gui from RSE, we first need to shut down the demo.
In the terminal window just established, determine the process of the signal_analyzer_gui program that is running. This can be done with the ps command.
Identify the signal_analyzer_gui process number. In this case it is 931. Now execute the kill command for process 931
kill 931
This will stop the signal_analyzer_gui and effectively end the demo.
Now we can return to the C++ perspective and run the signal_analyzer_gui that we just modified.
In the upper right corner of the SDK window, there is a down arrow icon that provides a selection of the active perspectives. Click it and select C/C++ to return to the C/C++ perspective.
Expand the signal_analyzer_gui project in the Project Explorer pane.
Then expand the Binaries item and right click on signal_analyzer_gui [arm/le]
Then select Run As > Run Configurations.
When the Run Configurations dialog appears, double click on Remote ARM Linux Application in the left portion of the screen. This will initiate a run configuration for the signal_analyzer_gui binary file.
From the Connection selection box near the top of the screen, select the IP address of your ZC702. In our case this is 192.168.1.65.
In the middle of the screen for the Remote Absolute File Path for C/C++ Application: click the browse button. Expand Root and then expand / and select media. Click OK
In the text entry box for Remote Absolute File Path for C/C++ Application:, append /signal_analyzer_gui. This instructs SDK where to place the executable file before running it.
Click Apply and then click Run.
The signal analyzer demo will re-start, but with the new signal analyzer layout including the new static display item just added as shown above.
In some instances, the Zynq logo display and the display of the signal analyzer configuration in the lower left portion of the screen may not appear after the re-start. If this happens, return to a console terminal view, find the signal_analyzer_gui process and kill it. Then re-start the demo with the following:
source /media/autostart.sh
This should re-start the demonstration with all of the items displayed properly.
CAUTION:
Petalinux has a built in timeout that will shut off the display after a period of inactivity. If the signal_analyzer_gui executable is not started through RSE before this timeout period elapses, the Petalinux will not respond to RSE properly and a restart of the ZC702 will be required.
Conclusion
Support by the Zynq-7000 AP Soc and its infrasturcture for a standard graphics and application development framework such as Qt provides a powerful but easy to use means for system developers to quickly build a wide variety of graphics based systems. The computing power of the dual ARM processors coupled with the ability to offload some tasks to hardware enables smooth operation of graphics and compute intensive applications.
© Copyright 2019 - 2022 Xilinx Inc. Privacy Policy

