How to debug Linux Application in SDK 2017.4
In this brief tutorial we shall discuss how to debug a Linux application running on Zynq UltrascaleTable of Contents
Building the Linux Images:
The steps to build the project here are explained in the wiki page here with the addition of thePHY node to the GEM node:
&&gem3 {
    status = "okay";
    local-mac-address = [00 0a 35 00 02 90];
    phy-mode = "rgmii-id";
    phy-handle = <&&phy0>;
    phy0: phy@c {
        reg = <0xc>;
        ti,rx-internel-delay = <0x8>;
        ti,tx-internel-delay = <0xa>;
        ti,fifo-depth = <0x1>;
    };
};
Also, make sure that the tcf-agent is enabled in the rootfs:
- petalinux-config -c rootfs
Copy the sysroots folder from the temporal directory to a local directory that is accessible to the SDK running on your host machine.
To find the TMP directory:
- petalinux-config
- Yocto Settings
- TMPDIR Location
- Yocto Settings
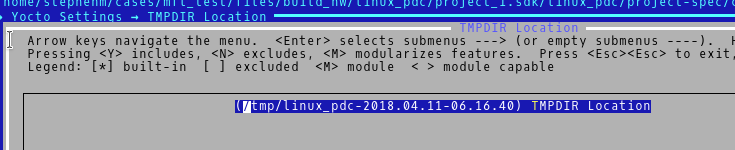
for example:
- cp -R /tmp/linux_pdc-2018.04.11-06.16.40/sysroots .
Setting up the LAN:
To debug an linux application running on the kernel, then the local machine needs to be connected to the board in a Local Area Network (LAN).Below are my HOST settings:

Then boot your kernel, and setup the board IP address:

Make sure you can ping the host before continuing
Create the SDK Linux Application Project:
Launch SDK on the same machine as the HOST settings are set up on.
Then File -> New -> Application Project:

For the Linux System Root, browse to the plnx_aarch64 copied over in previous step.
Select Next, and choose the Linux Empty Application template and select finish.
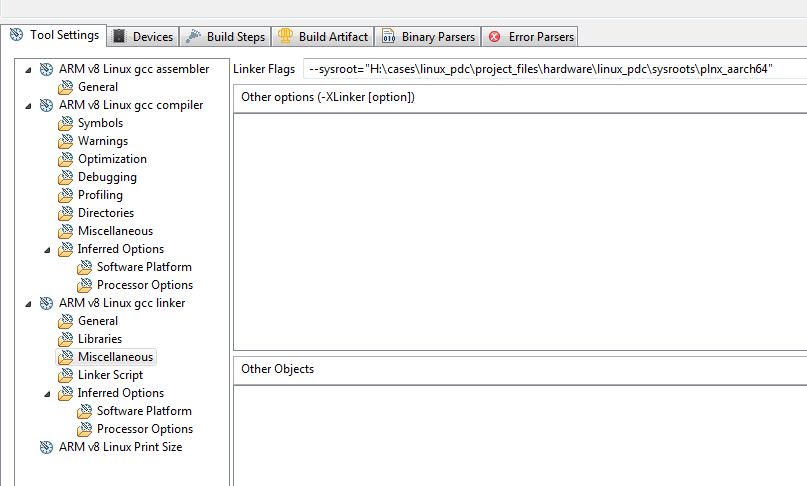
Note: you may see an error on the console. To address this, right click on the gpio_linux application in the Project Explorer in SDK,
and select C/C++ Build Settings:
Right click on the gpio_linux/src folder in the Project Explorer and select New -> Source File. Give this a name, and then copy the contents below into this newly created one.
#include <stdio.h>
#include <stdlib.h>
#include <unistd.h>
#include <sys/mman.h>
#include <fcntl.h>


#define GPIO_MAP_SIZE           0x10000
#define GPIO_DATA               0x00
#define GPIO_TRI                0x04
#define LED_NUM             256

#define LED_DELAY             10000000


int main(int argc, char *argv[])
{
    int fd;
    char *uiod = "/dev/uio0";
    void *gpio_ptr;
    volatile int Delay;

    printf("AXI GPIO UIO test.\n");

    // open the UIO device file to allow access to the device in user space

    fd = open(uiod, O_RDWR);
    if (fd < 1) {
        printf("Invalid UIO device file:%s.\n", uiod);
        return -1;
    }

    // mmap the GPIO device into user space

    gpio_ptr = mmap(NULL, 4096, PROT_READ|PROT_WRITE, MAP_SHARED, fd, 0);
    if (gpio_ptr == MAP_FAILED) {
        printf("Mmap call failure.\n");
        return -1;
    }

    // set bit0 on the GPIO to be output
    // see pg144 for ref

    *((volatile unsigned *)(gpio_ptr + GPIO_TRI)) = 0x0;


    // Toggle the LED
    while (1) {
        int i;
        unsigned char led_pin = 0x0;
        for (i = 0; i < LED_NUM; i++) {
            *((volatile unsigned *)(gpio_ptr + GPIO_DATA)) = led_pin;
            for (Delay = 0; Delay < LED_DELAY; Delay++);
            *((volatile unsigned *)(gpio_ptr + GPIO_DATA)) = 0x0;
            led_pin++;
        }
    }


    // unmap the GPIO device from user space

    munmap(gpio_ptr, 4096);
    return 0;
}
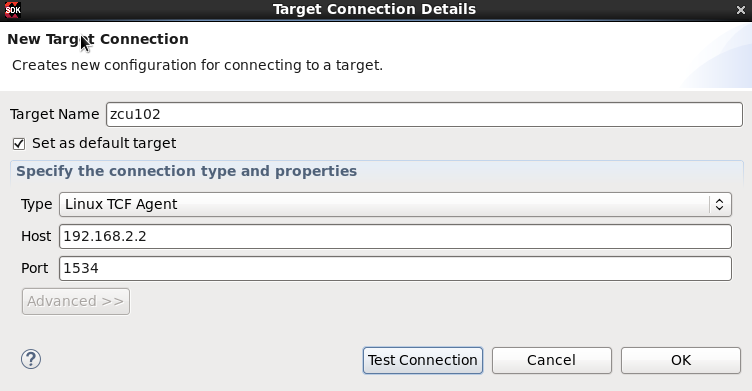
Next, we need to setup the Target connection. In the Target connection, drop down the Linux Agent, and select Add new target connection:
To Debug, Right click on the GPIO_LINUX application in the Project Explorer, and select Debug -> Debug As.
Double click on the Xilinx C/C++ application (System Debugger) to create a new debug configuration:
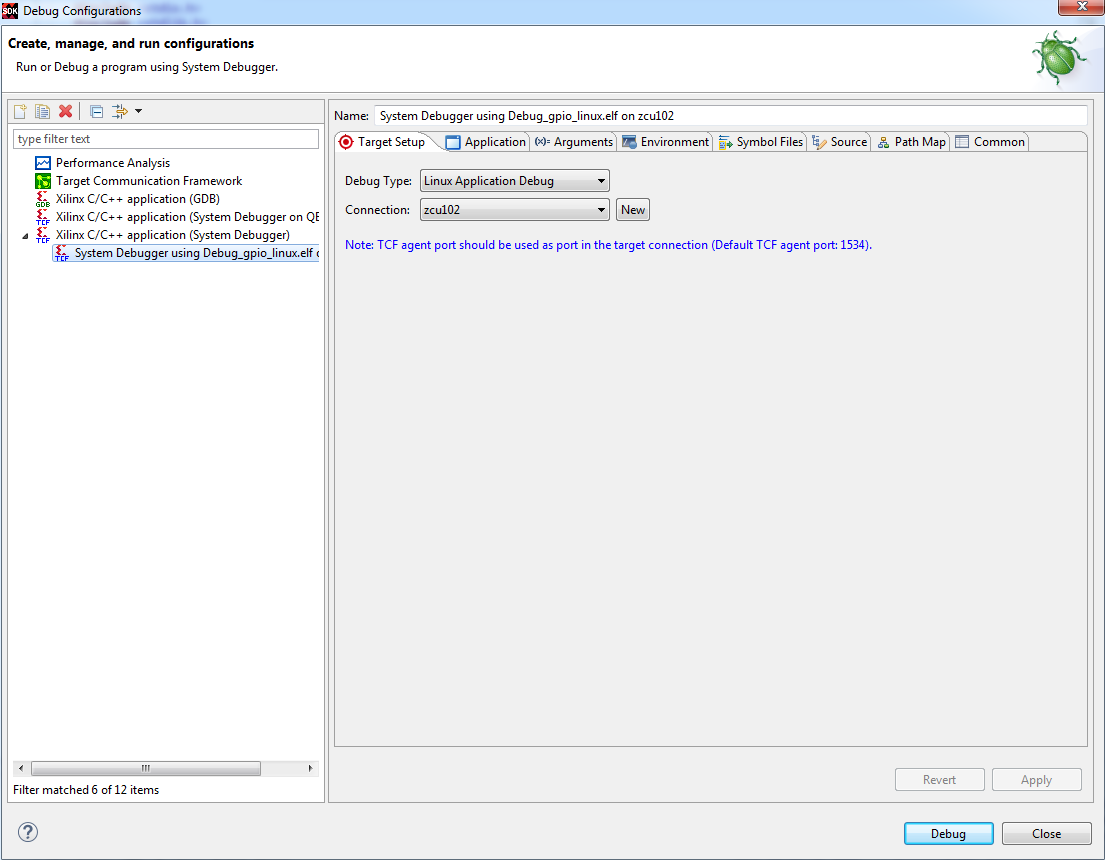
Make sure that the Application is setup correctly:

Upon pressing Debug, the user will be asked if they would like to enter the debug perspective. Select Yes.
In the Debug Perspective will have all the debug option available to debug your application:

Users can step over to step through the code line by line. Users can also step into if the user would like to step into a function. Or, you can just resume .
Resume will execute until it hits a breakpoint (at exit in this case). If you monitor the LED on the board, you should see the LEDs toggling continuosly.